Esgian
A set of technological solutions for the shift to sustainable future
The Challenge
What we did
- UX/ UI Design
- agile development flow(connected to product teams)
- centralized backend with administration and rest API
- web frontend apps(6 dedicated products)
- mobile app
- QA and version control
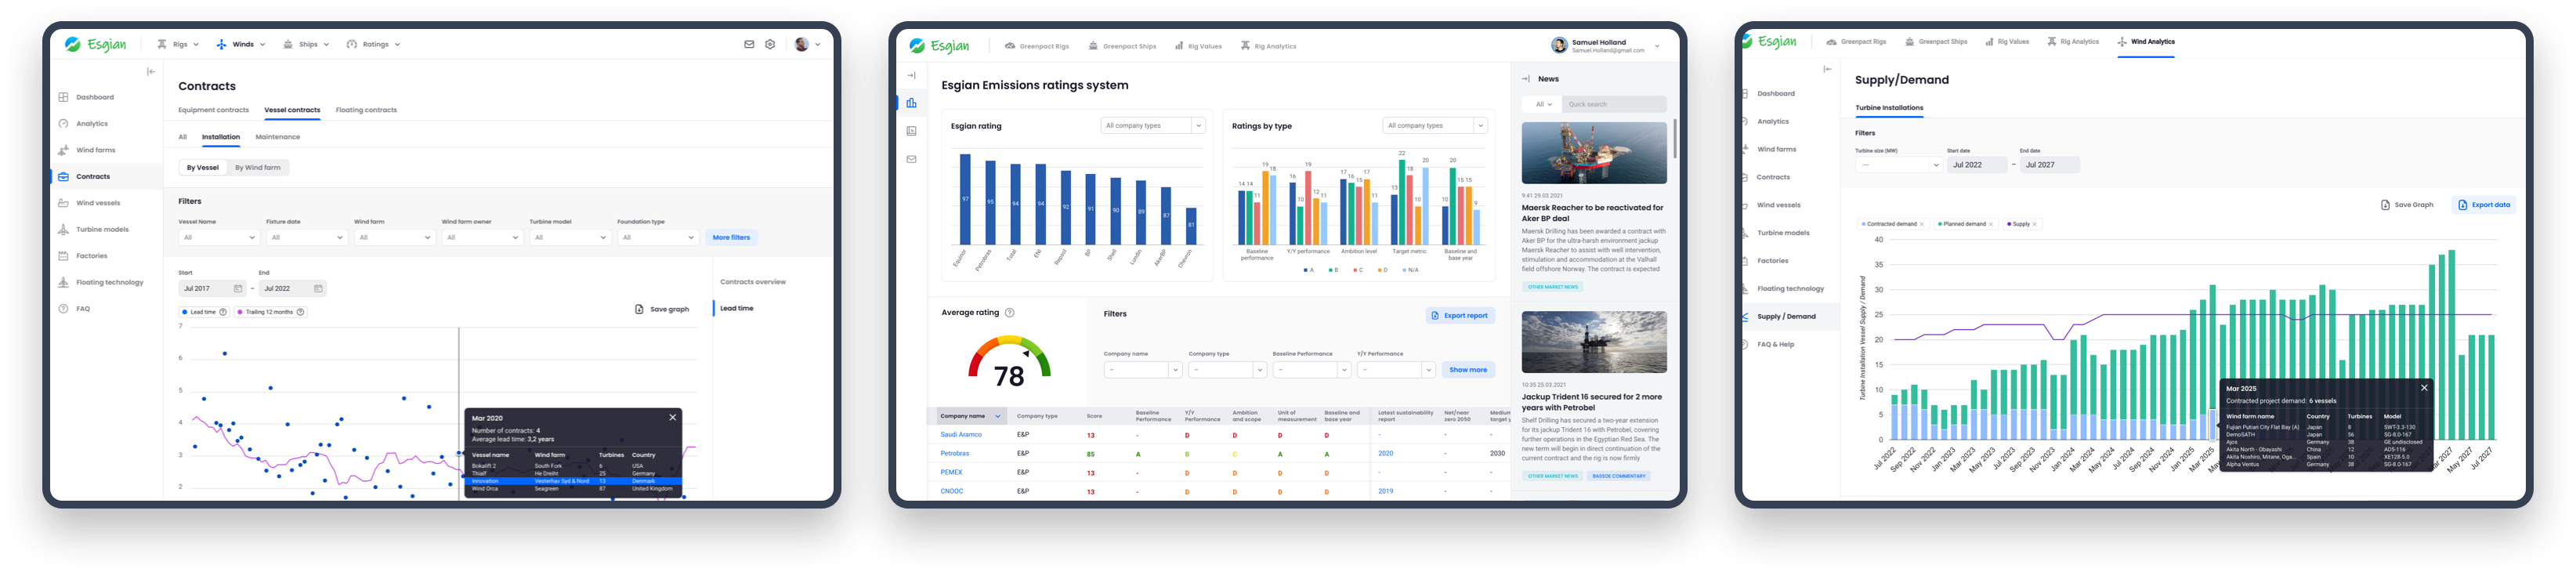
Green energy
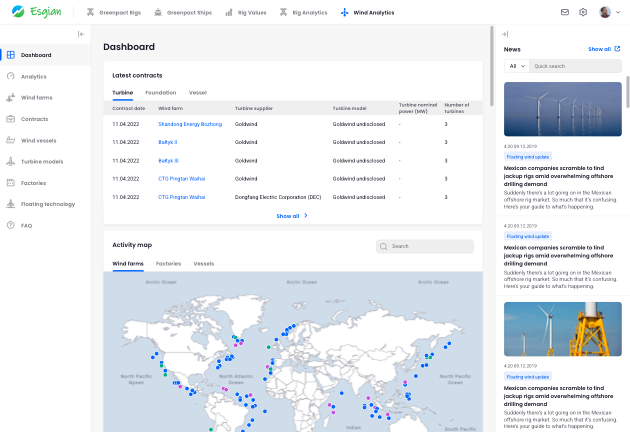
GreenPact Wind product maps offshore wind farms around the world, next to all technical specs even show the exact positions of existing turbines installed.
It also maps the development plans, contracts, and activities of vessels installing the turbines.
Calculation of emissions
Other Esgian products mapping activities related to drilling in the ocean floor. Users can define the contract specifications and the system returns a list of rigs that can do such a contract and shows which drilling rigs are available. The best product value is presented by the fact the system calculates predictions of fuel consumption, job duration, and pollution made by each drilling rig. Similar forecasts of energy and emissions are calculated even for tankers delivering oil to the shore.
The product is also mapping real historical data of emissions for the last few years, based on rig activities.
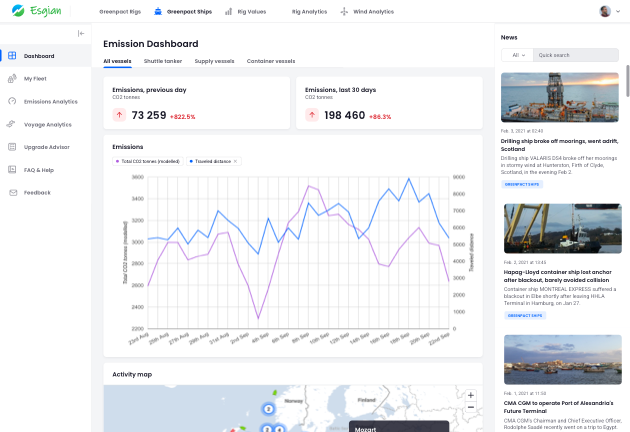
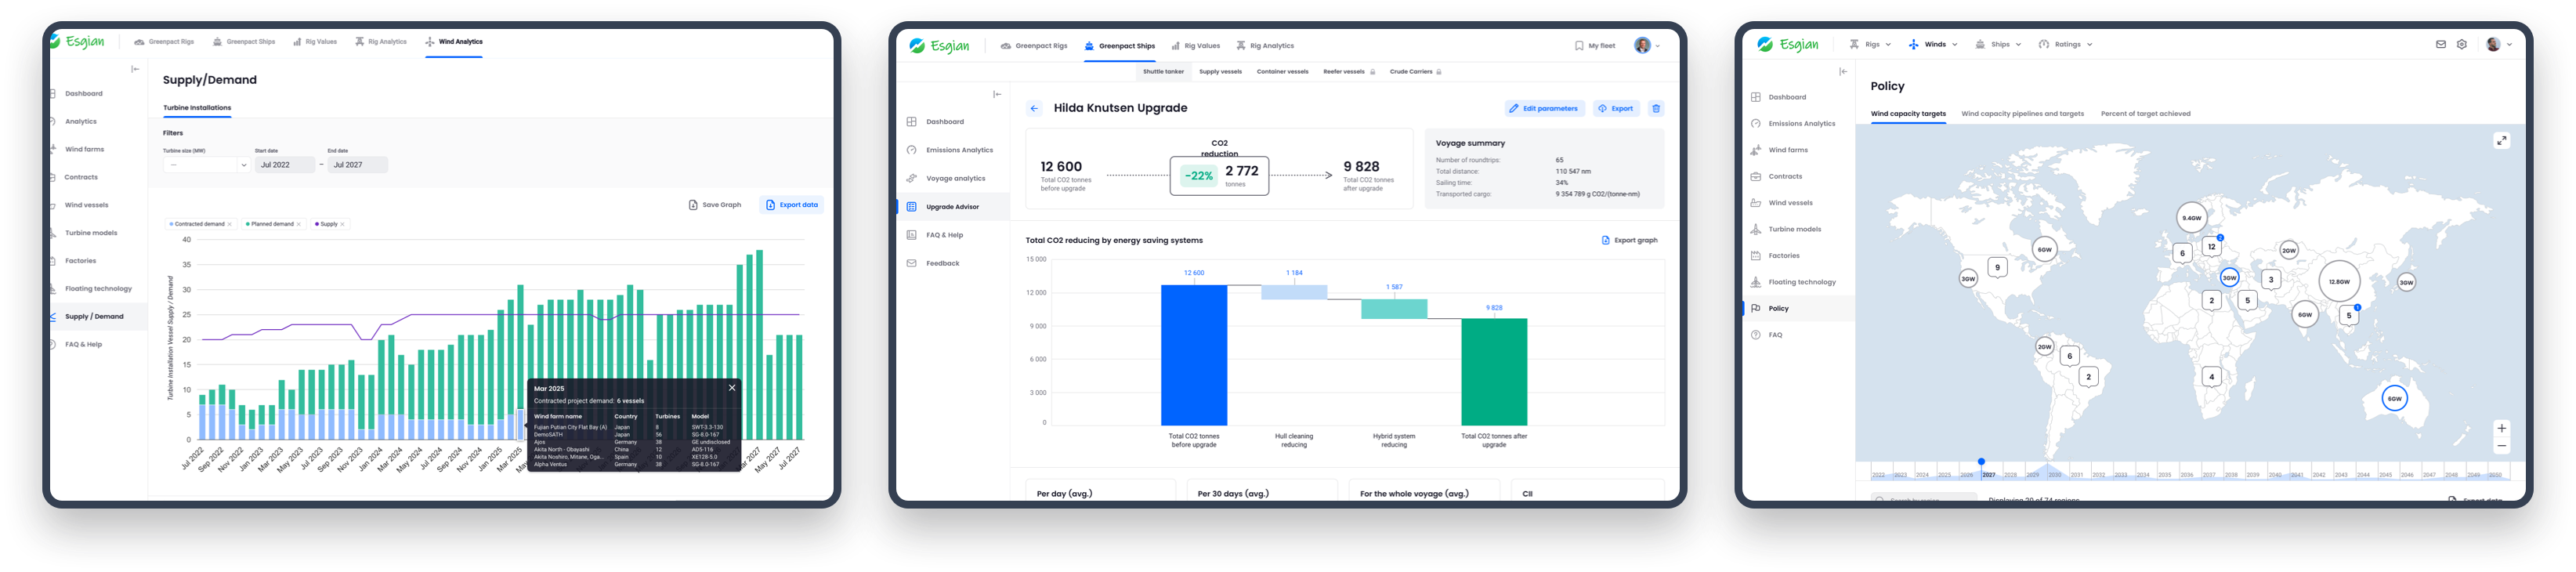
Shipping industry
Greenpact ships product tracking a fleet of a few hundred vessels such as tankers, car carriers, and others. The system is loading real AIS data from vessels and based on vessel size, draught, and speed calculates fuel consumption and based on fuel type all types of emissions.
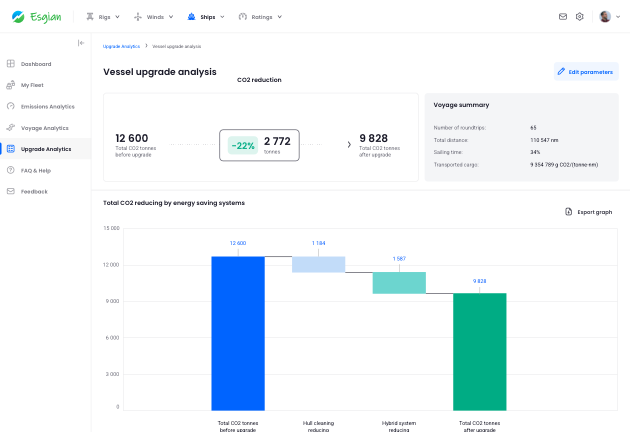
Upgrade analytics
Greenpact products are also able to predict savings on fuel consumption, time duration, or specific emissions based on the application of various saving systems on drilling rigs or vessels. Users get a great analysis of cost and savings in planning to install new technologies on their devices.
Phase
Product concept
We will have a lot of questions here. Ideally, we should understand what problems your tool is solving, who is your typical customer and other details. As for the output, we will design your online product from A to Z. Within this milestone, we will deliver a functional prototype explaining the whole user experience, a technical document that will describe any additional logic, and a final design system defining rules related to the user interface.
MVP
development
and launchA minimal viable product version should be the minimum that can be launched in the production environment and will be able to fulfill the purpose of the product. We will take the output from the analysis and will start the implementation work. Whole development infrastructure and processes will be created within this step and will be useful even for further development in the future.
Post-launch
agile
developmentIdeally, we should not stop with the MVP launch. The team will be deeply involved in the project so it is a great opportunity to keep the progress at the same speed and start agile development of any new features and improvements the product will need. We will need to agree on the team size, team velocity, and appropriate monthly budget. Typically, we are working in 2 weeks sprints and deploy a new version at the end of each one of them.
Testing + feedback
Wireframes


Colors & Typography


Prototypes